Financial Services

Consumer finance industry has gone through transformation with FinTech...

Read More

Retail

Retail industry is changing rapidly with the advent of online ecommerce...

Read More

Industrial

AI is the driving force behind industry 4.0 revolution...

Read More

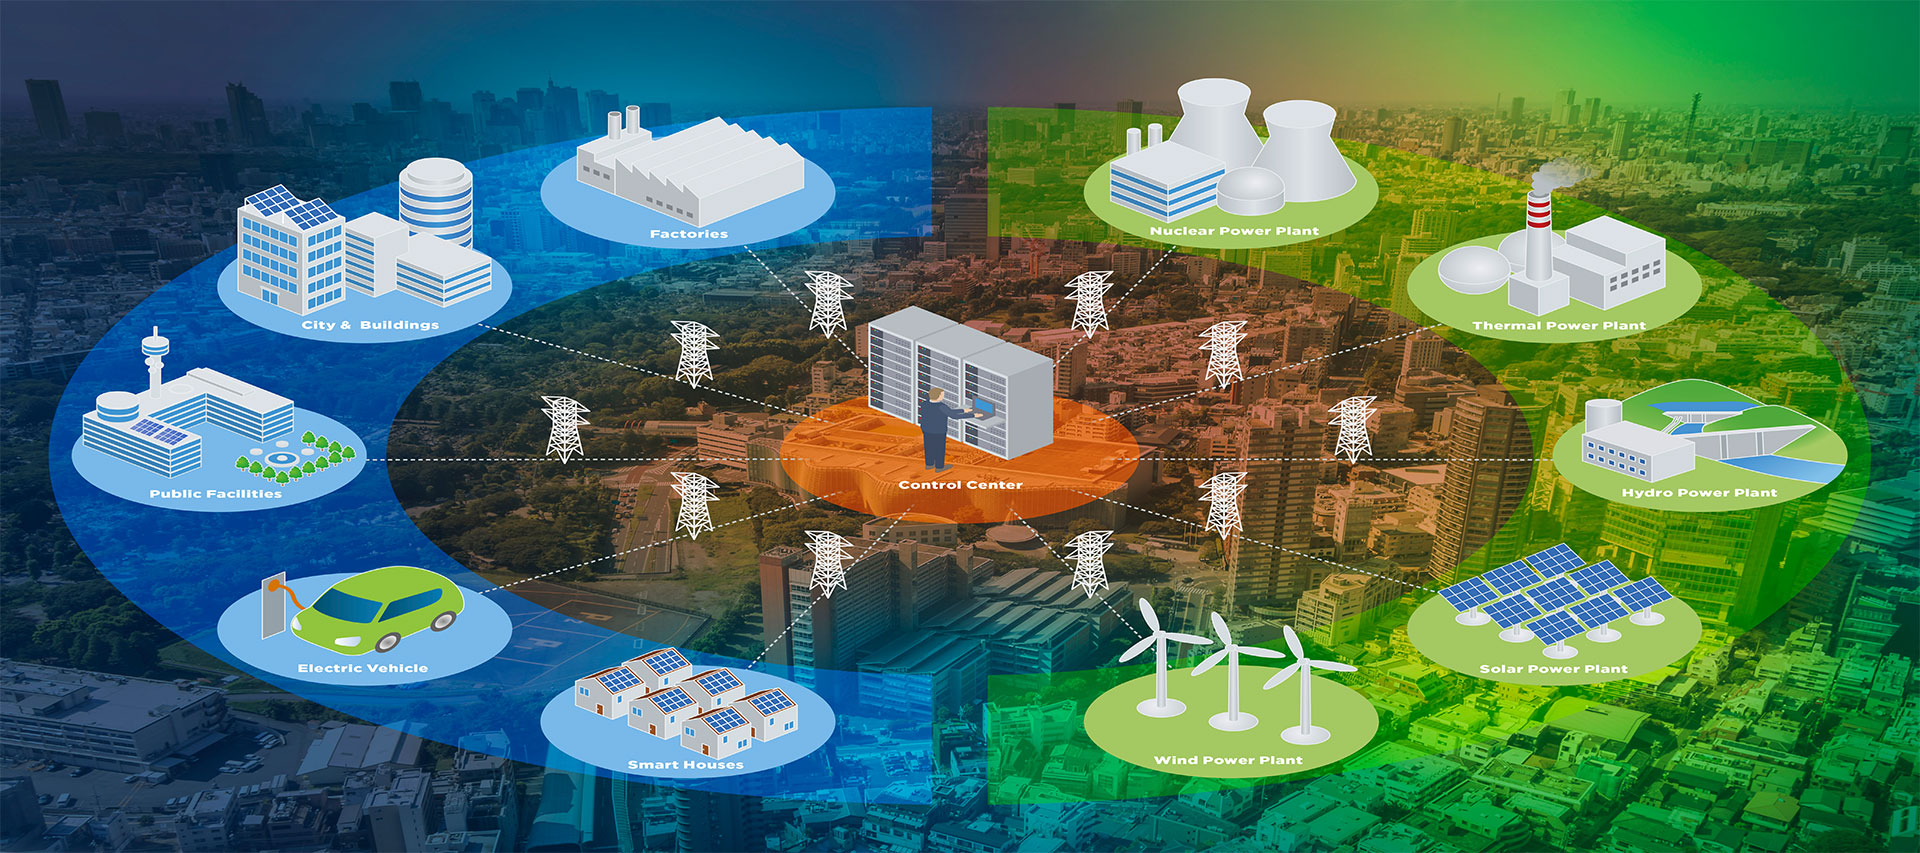
Energy

Shaping the greener energy economy for the coming decades...

Read More

Recent Blogs


blog grid image

CASINOS & EVOLVING ANA...

Analytics are used by companies to be more competitive and the financial services industry has known this for decades.  In fact, many financial services analytics professionals are moving to gaming as both industries need to balance risks and returns. More and more, casinos are using analytics to make decisions in areas that have traditionally relied upon “expertise” rather than data-driven approaches to increase profits…

    Where to strategically place games on the casino floor


Today, modeling teams at a number of casinos use software such as SAS to predict the impact of moving games from one area of a casino floor to another1.  

To set a baseline, data is collected on how much money each game, whether table games or slots, currently brings in as well as how people move about the casino. When the gathered data is combined with the odds of a particular game paying out, the analytics team can model what the performance would look like in different locations to help determine where the game should be placed in order to achieve the optimal performance level.  This is a similar technique used by supermarket companies. Just as with a grocery store, where on the casino floor would you get the best yield?

       A holistic data-driven approach for all casino operations


Gaming revenue is not the largest portion of what casinos bring in. They derive much of their revenue from their resort operations. For example, a good way to encourage gambling is to give customers free nights or discounted dinners in the hotel that houses a casino. But the casino would lose money if it did so for everyone, because some people don’t gamble much. To help pinpoint such offers, savvy Casinos run customer analytics applications on data it has collected showing how often individual guests gamble, how much money they tend to spend in the casino and what kinds of games they like. This is all part of a significant shift in how casinos do business where it’s getting to the point that casinos are being run like financial services firms.

       The challenges of shifting to Big Data


At MGM Resorts’ 15 casinos across the United States, thousands of visitors are banging away at 25,000 slot machines. Those visitors rang up nearly 28 percent of the company’s $6 billion in annual domestic revenue in 2013. Using the game and customer data that MGM collects daily and the behind-the-scenes software that transforms the data into critical insights, in turn, boost the customer experience and profit margins2.

Lon O’Donnell, MGM’s first-ever director of corporate slot analytics, is challenged to show why big data is a big deal when it comes to plotting MGM’s growth. “Our goal is to make that data more digestible and easier to filter,” says O’Donnell, who estimates that Excel still handles an incredible 80 percent of the company’s workload. In the near term, that means the team is experimenting with data visualization tools (Slotfocus dashboard - right) to make slot data more crunchable. Heavy-lifting analytics are a goal down the road3.  MGM isn’t the only gaming company interested in big data - nor was it the first. That distinction goes to Gary Loveman, who left teaching at Harvard Business School for Las Vegas in the late 1990s and turned Harrah’s into gaming’s first technology-centric player.

History has caught up with the industry. For decades, Las Vegas casinos were some of the only legal gambling outfits in the country, so they could afford to be complacent. That advantage disappeared during the past two decades with the rise of legal gambling in 48 states. The switch to slicker, more sophisticated cloud apps is still on the horizon. One reason why is the regulatory nature of gaming: Casinos tend to organize data in spreadsheets to report to regulators, who review the accounting and verify that slots perform within legal specifications. But those reports are not ideal business intelligence sources.

       Using Big Data to catch cheaters


Casinos are at the forefront of new tools to help them make more money and reduce what they consider to be fraud. One tool is something called non-obvious relationship awareness (NORA) software that allows casinos to determine quickly if a potentially colluding player and dealer have ever shared a phone number or a room at the casino hotel, or lived at the same address4,5. “We created the software for the gaming industry,” says Jeff Jonas, founder of Systems Research & Development, which originally designed NORA. The technology has proved so effective that Homeland Security adapted it to sniff out connections between suspected terrorists. “Now it’s used as business intelligence for banks, insurance companies and retailers,” Jonas says.  The image above shows three types of cameras feed the video wall in the Mirage’s surveillance room (top-right):  Fixed-field-of-view units focus on tables; motorized pan-tilt-zoom cameras survey the floor; and 360-degree cams take in an entire area.

Big Data and attendant technologies are starting to transform businesses right before our very eyes. Old ways of doing things are beginning to fall by the wayside. When specific examples like NORA become more public, Big Data suddenly becomes less abstract to those who make decisions.

Analytics are used by companies to be more competitive and the financial services industry has known this for decades.  In fact, many financial services analytics professionals are moving to gaming as both industries need to balance risks and returns. More and more, casinos are using analytics to make decisions in areas that have traditionally relied upon “expertise” rather than data-driven approaches to increase profits…

    Where to strategically place games on the casino floor


Today, modeling teams at a number of casinos use software such as SAS to predict the impact of moving games from one area of a casino floor to another1.

To set a baseline, data is collected on how much money each game, whether table games or slots, currently brings in as well as how people move about the casino. When the gathered data is combined with the odds of a particular game paying out, the analytics team can model what the performance would look like in different locations to help determine where the game should be placed in order to achieve the optimal performance level.  This is a similar technique used by supermarket companies. Just as with a grocery store, where on the casino floor would you get the best yield?

       A holistic data-driven approach for all casino operations


Gaming revenue is not the largest portion of what casinos bring in. They derive much of their revenue from their resort operations. For example, a good way to encourage gambling is to give customers free nights or discounted dinners in the hotel that houses a casino. But the casino would lose money if it did so for everyone, because some people don’t gamble much. To help pinpoint such offers, savvy Casinos run customer analytics applications on data it has collected showing how often individual guests gamble, how much money they tend to spend in the casino and what kinds of games they like. This is all part of a significant shift in how casinos do business where it’s getting to the point that casinos are being run like financial services firms.

       The challenges of shifting to Big Data


At MGM Resorts’ 15 casinos across the United States, thousands of visitors are banging away at 25,000 slot machines. Those visitors rang up nearly 28 percent of the company’s $6 billion in annual domestic revenue in 2013. Using the game and customer data that MGM collects daily and the behind-the-scenes software that transforms the data into critical insights, in turn, boost the customer experience and profit margins2.      

Lon O’Donnell, MGM’s first-ever director of corporate slot analytics, is challenged to show why big data is a big deal when it comes to plotting MGM’s growth. “Our goal is to make that data more digestible and easier to filter,” says O’Donnell, who estimates that Excel still handles an incredible 80 percent of the company’s workload. In the near term, that means the team is experimenting with data visualization tools (Slotfocus dashboard - right) to make slot data more crunchable. Heavy-lifting analytics are a goal down the road3.  MGM isn’t the only gaming company interested in big data - nor was it the first. That distinction goes to Gary Loveman, who left teaching at Harvard Business School for Las Vegas in the late 1990s and turned Harrah’s into gaming’s first technology-centric player.

History has caught up with the industry. For decades, Las Vegas casinos were some of the only legal gambling outfits in the country, so they could afford to be complacent. That advantage disappeared during the past two decades with the rise of legal gambling in 48 states. The switch to slicker, more sophisticated cloud apps is still on the horizon. One reason why is the regulatory nature of gaming: Casinos tend to organize data in spreadsheets to report to regulators, who review the accounting and verify that slots perform within legal specifications. But those reports are not ideal business intelligence sources.

       Using Big Data to catch cheaters


Casinos are at the forefront of new tools to help them make more money and reduce what they consider to be fraud. One tool is something called non-obvious relationship awareness (NORA) software that allows casinos to determine quickly if a potentially colluding player and dealer have ever shared a phone number or a room at the casino hotel, or lived at the same address4,5. “We created the software for the gaming industry,” says Jeff Jonas, founder of Systems Research & Development, which originally designed NORA. The technology has proved so effective that Homeland Security adapted it to sniff out connections between suspected terrorists. “Now it’s used as business intelligence for banks, insurance companies and retailers,” Jonas says.  The image above shows three types of cameras feed the video wall in the Mirage’s surveillance room (top-right):  Fixed-field-of-view units focus on tables; motorized pan-tilt-zoom cameras survey the floor; and 360-degree cams take in an entire area.

Big Data and attendant technologies are starting to transform businesses right before our very eyes. Old ways of doing things are beginning to fall by the wayside. When specific examples like NORA become more public, Big Data suddenly becomes less abstract to those who make decisions.

blog grid image

PREDICTIVE POLICING

The National Institute for Justice explains that “predictive policing tries to harness the power of information, geospatial technologies and evidence-based intervention models to reduce crime and improve public safety. This two-pronged approach — applying advanced analytics to various data sets, in conjunction with intervention models — can move law enforcement from reacting to crimes into the realm of predicting what and where something is likely to happen and deploying resources accordingly.”

Today, more and more police departments are using algorithms that predict future crimes. Predictive policing is just one tool in this new, tech-enhanced and data-fortified era of fighting and preventing crime. As the ability to collect, store and analyze data becomes cheaper and easier, law enforcement agencies all over the world are adopting techniques that harness the potential of technology to provide more and better information. But while these new tools have been welcomed by law enforcement agencies, they’re raising concerns about privacy, surveillance and how much power should be given over to computer algorithms1.

The Origins of Predictive Policing

The notion of crime forecasting dates back to 1931, when sociologist Clifford R. Shaw of the University of Chicago and criminologist Henry D. McKay of Chicago’s Institute for Juvenile Research wrote a book exploring the persistence of juvenile crime in specific neighborhoods. Scientists have experimented with using statistical and geospatial analyses to determine crime risk levels ever since. In the 1990s, the National Institute of Justice (NIJ) and others (including the New York Police department) embraced geographic information system tools for mapping crime data, and researchers began using everything from basic regression analysis to cutting-edge mathematical models to forecast when and where the next outbreak might occur. But until recently, the limits of computing power and storage prevented them from using large data sets.

Jeffrey Brantingham is a professor of anthropology at UCLA who helped develop the predictive policing system that is now licensed to dozens of police departments under the brand name PredPol. “This is not Minority Report,” he’s quick to say, referring to the science-fiction story often associated with PredPol’s technique and proprietary algorithm. “Minority Report is about predicting who will commit a crime before they commit it. This is about predicting where and when crime is most likely to occur, not who will commit it.”

Brantingham also emphasized that the algorithm cannot replace police work; it’s intended to help police officers do their jobs better. “Our directive to officers was to ‘get in the box’ and use their training and experience to police what they see,” said Cmdr. Sean Malinowski, the LAPD’s chief of staff. “Flexibility in how to use predictions proved to be popular and has become a key part of how the LAPD deploys predictive policing today2.”

What is PredPol?

Dozens of cities across the US and beyond are using the PredPol software to predict a handful of other crimes, including gang activity, drug crimes and shootings. Police in Atlanta use PredPol to predict robberies. Seattle police are using it to target gun violence. In England, Kent police have used PredPol to predict drug crimes and robberies. In Kent, it’s not just police taking a more proactive approach by concentrating officers in prediction areas, but also civilian public safety volunteers and drug intervention workers.

The prediction algorithm is constantly reacting to crime reports in these cities, and a red box predicting crime can move at any moment. But although officers in the divisions using PredPol are required to spend a certain amount of time in those red boxes every patrol, they’re not just blindly following the orders of the crime map. The officer still has a lot of discretion. It’s not just the algorithm. The officer still has to know the area well enough to know when to adjust and go back into manual mode.

PredPol’s predictive policing is the sum of two parts:

1. Predictive Policing Technology: An algorithm developed from high-level mathematics and sociological and statistical analysis of criminality. This algorithm factors in historical crime data from the police department and produces predictions on where and when a crime is most likely to occur.

2. Insights of officers and crime analysts. According to the National Institute of Justice: “the predictive policing approach does not replace traditional policing. Instead, it enhances existing approaches such as problem-oriented policing, community policing, intelligence-led policing and hot spot policing.”

Predictive policing is more than traditional hotspot mapping. Predictive Policing’s forecasting technology includes high-level mathematics, machine learning, and proven theories of crime behavior, that take a forward-looking approach to crime prevention3.

While PredPol’s predictive boxes predict that a crime will happen in the prediction area, there is no guarantee that an incident or arrest will occur. The presence of police officers in the prediction areas creates a deterrence and suppression effect, thus preventing crime in the first place.

PredPol does not collect, upload, analyze or in any way involve any information about individuals or populations and their characteristics – PredPol’s software technology does not pose any personal privacy or profiling concerns. The algorithm uses only three pieces of data – type, place, and time – of past crimes.

The Chicago Police Department Take Predictive Policing One Step Further

As with PredPol, the approach in predictive policing seeks to forecast where and when crime will happen; another focuses on who will commit crime or become a victim…

The Chicago Police have made it personal. The department is using network analysis to generate a highly controversial Strategic Subject List of people deemed at risk of becoming either victims or perpetrators of violent crimes. Officers and community members then pay visits to people on the list to inform them that they are considered high-risk4.

The Custom Notification program, as it’s called, was inspired in part by studies done by Andrew Papachristos, a sociologist at Yale University. Papachristos grew up in Chicago’s Rogers Park neighborhood in the 1980s and ’90s, at the height of the crack era. When he started studying crime, Papachristos wanted to understand the networks behind it. For a 2014 paper, he and Christopher Wildeman of Cornell University studied a high-crime neighborhood on Chicago’s West Side. They found that 41% of all gun homicide victims in the community of 82,000 belonged to a network of people who had been arrested together, and who comprised a mere 4% of the population—suggesting, with other studies, that much can be learned about crime by examining the company people keep, Papachristos says.

Intrigued by these ideas, the Chicago police teamed up with Miles Wernick, a medical imaging researcher at the Illinois Institute of Technology in Chicago, to develop the Custom Notification program. Because gang violence was distributed across the city, hot spot policing wasn’t as effective in Chicago, says Commander Jonathan Lewin, head of technology for the department. "The geography of the map isn’t as helpful as looking at people and how risky a person is," he says. The hope was that the list would allow police to provide social services to people in danger, while also preventing likely shooters from picking up a gun.

Validations / Concerns

A recent detailed report from the RAND corporation concluded that the Custom Notification program implemented in Chicago saved zero lives — and that overall the list of hundreds of likely shooters generated wasn’t even being used as intended. “There was no practical direction about what to do with individuals on the ‘Strategic Suspect List,’ little executive or administrative attention paid to the pilot, and little to no follow-up with district commanders,” the report concluded. One of its authors pointed out that Chicago’s police department had 11 different anti-violence programs going on, and the list of likely shooters “just got lost.” But it did identify one result of the program. People on the list were more likely to be arrested, prompting conclusion that it “essentially served as a way to find suspects after the fact5”.

That’s one of the biggest concerns about predictive policing. Some civil liberties groups argue that it just hides racial prejudice “by shrouding it in the legitimacy accorded by science.” If there’s a bias in the criminal justice system, that carries through to the statistics which are ultimately fed into the algorithms, says one analyst with the Human Rights Data Analysis Group and a Ph.D. candidate at Michigan State University. “They’re not predicting the future. What they’re actually predicting is where the next recorded police observations are going to occur.” In addition, with programs such as those used in Chicago and proprietary software like PredPol, the Human Rights Data Analysis Group stated “For the sake of transparency and for policymakers, we need to have some insight into what’s going on so that it can be validated by outside groups.”

Predictive Policing techniques such as the use of PredPol have shown promising results. But the ability to thoroughly validate the models through a third party has been challenging (with regards to analytics and public policies as well). With the advent of Big Data, predictive policing is still evolving, but civil liberties will have to be an integral part going forward. And at the end of the day, the analytics associated with predictive policing are just another set of tools, not an end all.

blog grid image

IMAGE RECOGNITION

Social media has transformed our way of communication and socialization in today’s world. Facebook and twitter are always on the lookout for more information about their users from their users. People eagerly share their information with the public which is used by the media agents to improve their business and services. This information comes from customers in the form of text, image or video. In the age of selfie, capturing every moment in the cell phone is a norm. Be it a private holiday, an earth quake shaking some part of the world or a cyclone blowing the roof over the head, everything is clicked and posted. These images are used as data by social media and researchers for image recognition, also known as computer vision.

Image recognition is the process of detecting and identifying an object or a feature in a digital image or video in order to add value to customers and enterprises. Billions of pictures are being uploaded daily on the internet. These images are identified and analysed to extract useful information. This technology has various applications as shown below. In this blog we will touch upon some of these applications and the techniques used therein.

Text Recognition

e will begin with the technique used to recognise a handwritten number. Machine learning technologies like deep learning can be used to do so. A brief note on AI, ML, DL and ANN before we proceed further. Artificial intelligence (AI) is human intelligence exhibited by machines by training the machines. Whereas Machine Learning (ML) is an approach to achieve artificial intelligence and deep learning is a technique for implementing machine learning. Artificial Neural Network (ANN) is based on the biological neural network. A single neuron will pass a message to another neuron across this network if the sum of weighted input signals from one or more neurons into this particular neuron exceeds a threshold. The condition when the threshold is exceeded and the message is passed along to the next neuron is called as activation1.

There are different ways to recognize images. We will use neural networks to recognize a simple handwritten text, number 8. A very critical requirement for machine learning is data, as much data as possible to train the machine well. A neural network takes numbers as input. An image is represented as a grid of numbers to the computer and these numbers represent how dark each pixel is. The handwritten text of number 8 is represented as below.

This 18x18 pixel image is treated as an array of 324 numbers. These are the 324 input nodes to the neural network as shown below.

The neural network will have two outputs. The first output will predict the likelihood that the image is an ’8’ and the second output will predict the likelihood that it is not an ’8’. The neural network is trained with different handwritten numbers to differentiate between ’8’and not an ’8’. So, when it is fed with an ’8’, it is trained to identify that the probability of it being an ’8’ is 100% and not being an ’8’ is 0%. So, now it can recognize ’8’ but only a particular pattern of 8. If there is a slight change in position or size, it may not recognise it. There are various ways to train it to identify ’8’ in any position and size. Deep neural network technique can be used to do so. To train better, we need more data and with increase in data, the network becomes bigger. This is done by stacking more layers of nodes and this is known as deep neural network. It does so by treating ’8’at the top separately from ’8’ at the bottom of a picture. This is avoided by using another technique called convolutional neural network. All these technologies are evolving rapidly with improved and refined approach to get better output.

Face Recognition

Face recognition is used to convey a person’s identity. It uniquely identifies us. Biometric face recognition technology has applications in various areas including law enforcement and non-law enforcement.

The conventional pipeline of face recognition consists of four stages4

Face detection is easier than face identification as all faces have the same features eyes, ears, nose, and mouth, almost in the same relative positions. Face identification is a lot more difficult as our face is constantly changing, unlike our fingerprints. With every smile, every expression our face gets transformed as the shape of our face contorts with our expression. Though humans can identify us even when we sport a different hairstyle, systems have to be trained to do so. Computers struggle with the problem of A-PIE or aging, pose, illumination, and expression. These are considered as sources of noise which make it difficult to distinguish between faces. A technique called deep learning helps reduce this noise and disclose the statistical features that the images of a single person have in common to uniquely identify that person.

DeepFace is a deep learning facial recognition system created by Facebook. It identifies human faces in digital images and employs a nine-layer neural net with over 120 million connection weights, and was trained on four million images uploaded by more than 4000 Facebook users5. This method reached an accuracy of 97.35%, almost approaching human-level performance.

Computer recognizes faces as collections of lighter and darker pixels. The system first clusters the pixels of a face into elements such as edges that define contours. Subsequent layers of processing combine elements into nonintuitive, statistical features that faces have in common but are different enough to discriminate them. The output of the processing layer below serves as the input to the layer above. The output of deep training the system is a representational model of a human face. The accuracy of the result depends on the amount of data, which in this case is the number of faces the system is trained on.

FBI’s Next Generation Identification (NGI)

FBI’s Criminal Justice Information Services (CJIS) Division developed and incrementally integrated a new system called the Next Generation Identification (NGI) system to replace the Integrated Automated Fingerprint Identification System (IAFIS). NGI provides the criminal justice community with the world’s largest and most efficient electronic repository of biometric and criminal history information6. The accuracy of identification using NGI is much less compared to Facebook’s DeepFace. One of the reasons is the poor quality of pictures that FBI uses. FBI normally uses the images obtained through public cameras which do not provide a face straight-on photograph. Whereas Facebook already has the information of all our friends and works with over 250 billion photos and over 4.4 million labelled faces compared to FBI’s over 50 billion photos. Thus, with more data Facebook has an edge in better identification. Facebook also has more freedom to make mistakes, since a false photo-tag carries much less weight than a mistaken police ID7. Facial recognition is of great use in automatic photo-tagging, but there is risk of false-accept rate while trying to identify a suspect and an innocent could be in trouble because of this.

Search and e-commerce

Google’s Cloud Vision API and Microsoft’s Project Oxford’s Computer Vision, face, and emotion APIs provide image-recognition solutions using deep, machine-learning algorithms to provide powerful ecommerce and retail applications that will enhance shopping experience of users and create new marketing opportunities for retailers8.

Cortexica9 uses its findSimilar™ software to provide services to retailers like Macy’s and Zalando. Cortexica does this by providing the retailer with an API. First, the images of all the items in the inventory are ingested in the software. The size and completeness of the dataset is important. Second, a Key Point Files (KPF) for each image, which is a proprietary Cortexica file, is produced. This file contains all the visual information needed to describe the image and help with future searches. Third, this system is then connected to the customer’s app or website search feature. Fourth, when the consumer sends an incoming query image, it is converted into a KPF, the visual match is computed and the consumer gets the matched results in order of visual similarity in couple of seconds.

This hot topic that is "visual search" is all driven by the alignment of consumer activity, with regards to their propensity to taking pictures, and the innovation of how retailers want their inventory to be discovered by consumers using their mobile devices. Facts like colour, texture, distinctive parts and shapes all need to be considered in designing the algorithm to meet the challenges of the broad range of retail fashion requirements.

Companies like Zugara11 use augmented reality (AR) shopping applications that allow a customer to try clothing in a virtual dressing room by overlaying an image of a dress or shirt and find what suits best. Here the app looks at the shopper via web camera and can capture the emotions of the consumer and send it to Google or Microsoft API for emotional analysis. Depending on the feedback from the API’s image analysis, the AR application can be guided to provide similar or different outfit to the customer12.

According to MarketsandMarkets, a global market research company and consulting firm, the image recognition market is estimated to grow from USD 15.95 Billion in 2016 to USD 38.92 Billion by 2021, at a CAGR of 19.5% between 2016 and 2021. The future of image recognition seems very interesting.

Realize your pilot benefits in weeks

Discussion on Problem Statement (4 hrs)

A meeting with the business sponsor and other senior stakeholders to understand the problem and business objectives.

Data Analysis (2-3 weeks)

Analyse data gaps, data quality and prepare data set for machine learning.

Model Development (4-8 weeks)

Develop and train alternative models, compare results and decide best suited model for the business purpose.

Trial Run (2-3 months)

Parallel run the model in lab and compare the predicted outcomes against production data set.

Production Deployment (4-5 months)

Deploy the pilot solution into production and realise the benefit of AI in your business.

Discussion on Problem Statement (4 hrs)

Data Analysis (2-3 weeks)

Model Development (4-8 weeks)

Trial Run (2-3 months)

Production Deployment (4-5 months)